The Fast Break – Victoria
In summary
- Soil moisture has generally stayed the same or increased over May.
- The Pacific Ocean is neutral but getting closer to El Niño values but the atmosphere is showing no interest yet.
- The Indian Ocean has gone against model predictions for a potential IOD-positive phase (drier) and currently looks more like IOD-negative.
- Despite stronger pressure and poor positioning of highs, rainfall has been sneaking in between the break in high-pressure systems.
Patchy rainfall has increased soil moisture reserves in some areas, but profiles are not yet full or wet in the coastal south-west, east Gippsland and southern north-east. Run-off into dams is yet to occur and won’t until soils are saturated, something that normally occurs in winter. Soil probe values stayed the same or increased across the state but did slightly decrease in east Gippsland.
The central Pacific Ocean surface temperature measured at NINO3.4 has a relative value getting close to the El Niño threshold. The eastern Pacific Ocean is slightly above the El Niño threshold of 0.8 °C. This is being fed by the much warmer than normal water under the Pacific that is upwelling off Ecuador and being blown by the trade winds across the equator. Despite the ocean getting a bit excited about El Niño, the atmosphere is yet to move with wind and cloud patterns not in keeping with a coupled ocean atmosphere event. Despite the SOI being at an El Niño-like negative value, this is being driven more by Tahiti pressure, where the pressure at Darwin is closer to normal. Higher pressure over the tropical north would not help moisture transport to Victoria, which is why we’ll keep watching the SOI. All models surveyed still predict the El Nino ocean threshold to be reached in coming months.
The Indian Ocean changed this month and is warm across the basin. Model predictions for winter are now highly varied, with few opting for +IOD. Current stronger westerly wind patterns are likely to further warm the eastern Indian Ocean, which is in turn driving a close to IOD-like value of the Dipole Mode Index. There is no evidence for an actual −IOD.
The Southern Annular Mode is currently in a moderately strong positive phase. In winter this would be expected to decrease frontal activity south of the Divide.
The Madden–Julian Oscillation is having a late-month burst of activity in the Coral Sea, probably helping the eastern coast rainfall. It’s predicted to play no part in Victoria’s rainfall once it moves further out into the Pacific.
Pressure patterns have been further south and stronger in pressure, normally a drier omen in winter. Watch to see if pressure patterns can start appearing around the top of the Bight in their normal winter position. If pressure remains stronger over Victoria that is likely to push weather systems south.
My assessment of 12 climate models for Victoria is for likely drier and likely warmer for the next 3 months.
Soil moisture
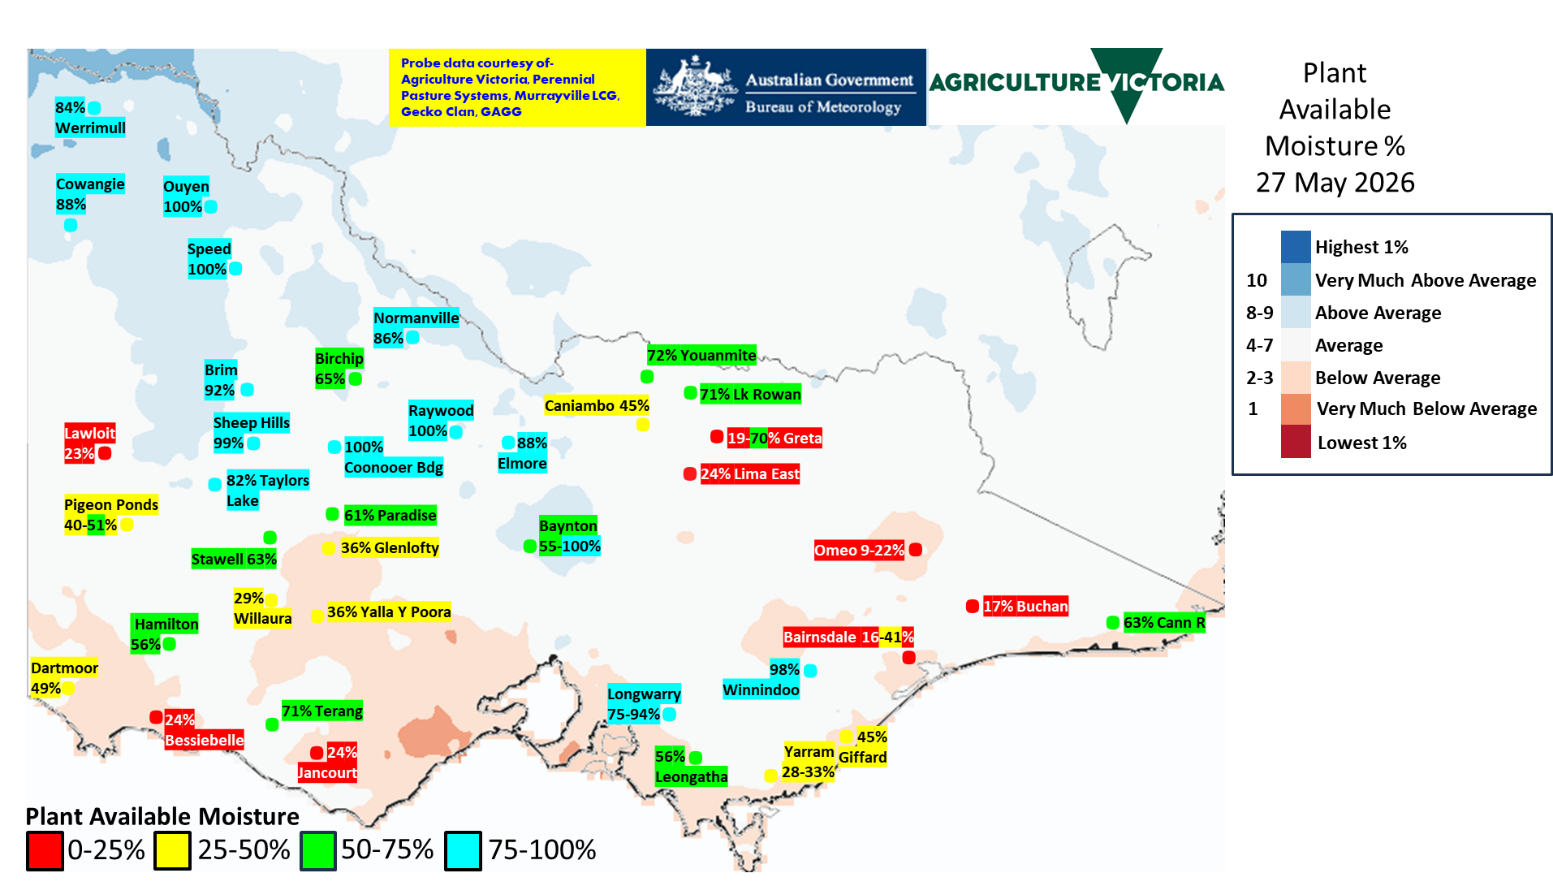
Plant-available moisture decile 27 May 2026
The BoM Australian Water Outlook (AWO) plant-available soil moisture deciles for perennial pasture shows marginal change from last month. The Mallee and parts of the northern country are ranked wetter than normal, but the far south-west and central region are ranked drier. Most of the state is ranked normal. Soil moisture probes either stayed the same or increased, a few by large amounts. The exceptions were in east Gippsland, where rainfall was not quite sufficient to maintain soil moisture.
In the last 30 days, the Hamilton crop increased by 50 percentage points from 6% to 56%. The Elmore crop increased by 14 percentage points from 74% to 88%
Soil moisture probe data can be accessed in real time at Agriculture Victoria’s soil moisture monitoring website.
Probes from Agriculture Victoria, Gecko Clan, Perennial Pasture Systems, Gippsland Agriculture Group and Murrayville Landcare networks.
| Omeo perennial | 9 |
| Bairnsdale perennial | 16 |
| Buchan perennial | 17 |
| Greta hill annual | 19 |
| Omeo multi specie | 22 |
| Lawloit lucerne | 23 |
| Lima East perennial | 24 |
| Jancourt perennial rye | 24 |
| Bessiebelle perennial | 24 |
| Yarram perennial rye | 28 |
| Greta annual pasture | 29 |
| Willaura | 29 |
| Yarram prairie grass | 33 |
| Yalla-Y-Poora crop | 36 |
| Glenlofty perennial | 36 |
| Pigeon Ponds phalaris | 40 |
| Bairnsdale perennial | 41 |
| Caniambo crop | 45 |
| Giffard fodder | 45 |
| Lake Rowan lucerne | 47 |
| Dartmoor lucerne | 49 |
| Pigeon Ponds rye and balansa | 51 |
| Baynton granite phalaris | 55 |
| Hamilton crop | 56 |
| Leongatha perennial | 56 |
| Paradise perennial | 61 |
| Stawell perennial | 63 |
| Cann River perennial | 63 |
| Birchip crop | 65 |
| Baynton basalt phalaris | 68 |
| Greta summer pasture | 70 |
| Terang perennial | 71 |
| Youanmite crop | 72 |
| Longwarry chicory | 75 |
| Longwarry perennial rye | 75 |
| Taylors Lake crop | 82 |
| Werrimull crop | 84 |
| Normanville crop | 86 |
| Elmore crop | 88 |
| Cowangie crop | 88 |
| Brim crop | 92 |
| Winnindoo | 98 |
| Sheep Hills crop | 99 |
| Coonooer Bridge crop | 100 |
| Ouyen crop | 100 |
| Raywood crop | 100 |
| Speed crop | 100 |
| Baynton granite annual | 100 |
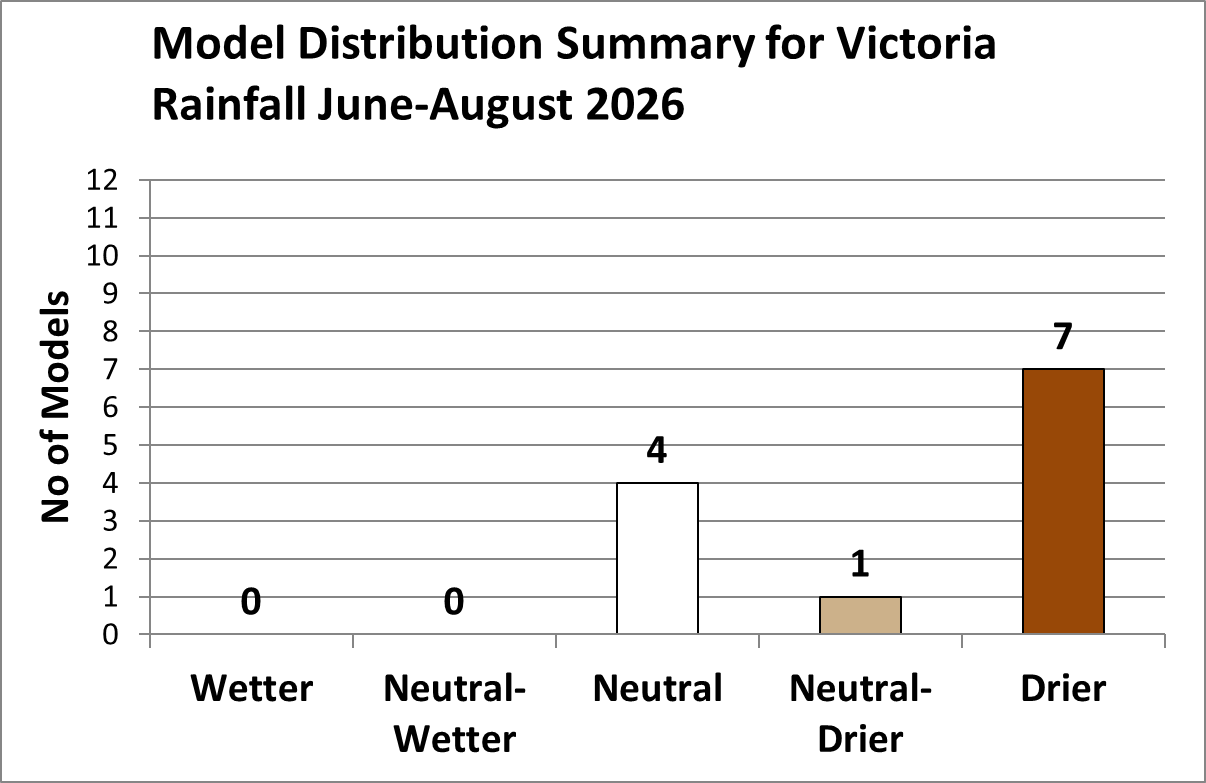
Model distribution summary for the next 3 months
Predictions for June to August 2026 Victorian rainfall – the outlook from 12 global model forecasts is likely drier.
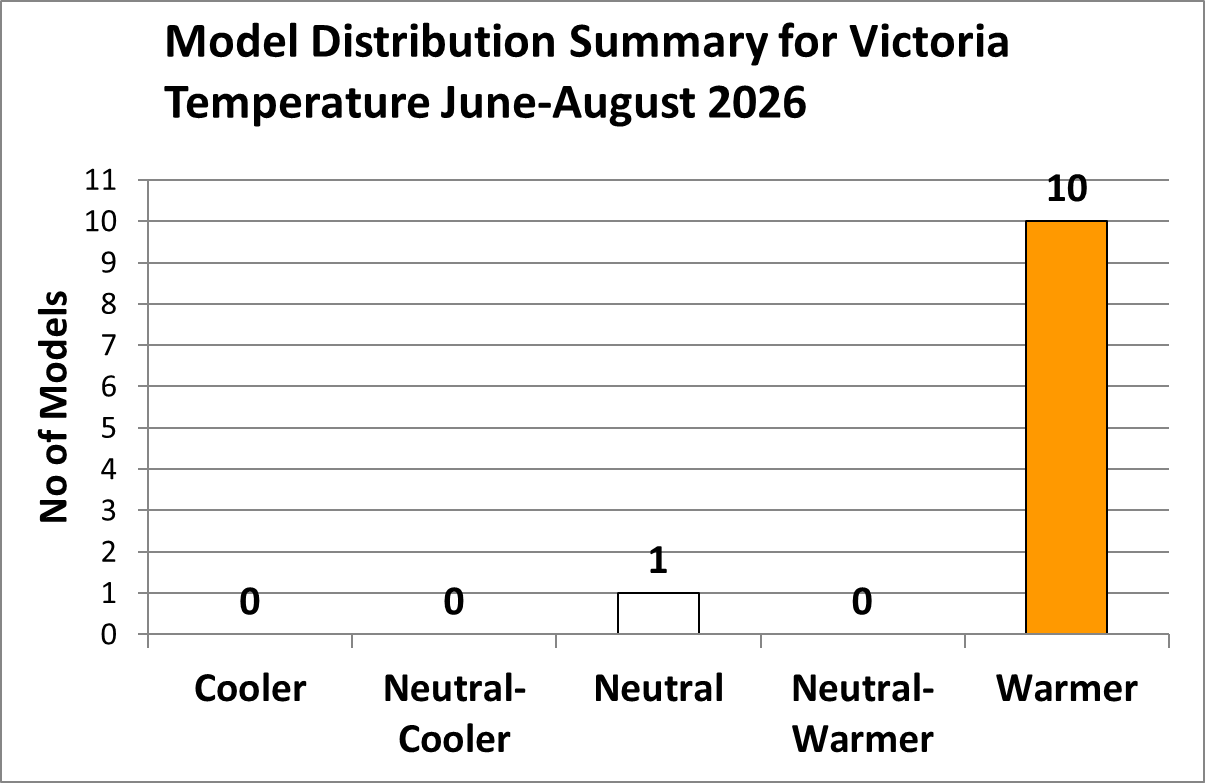
Predictions for June to August 2026 Victoria temperature – the outlook from 11 global model forecasts is for likely warmer.
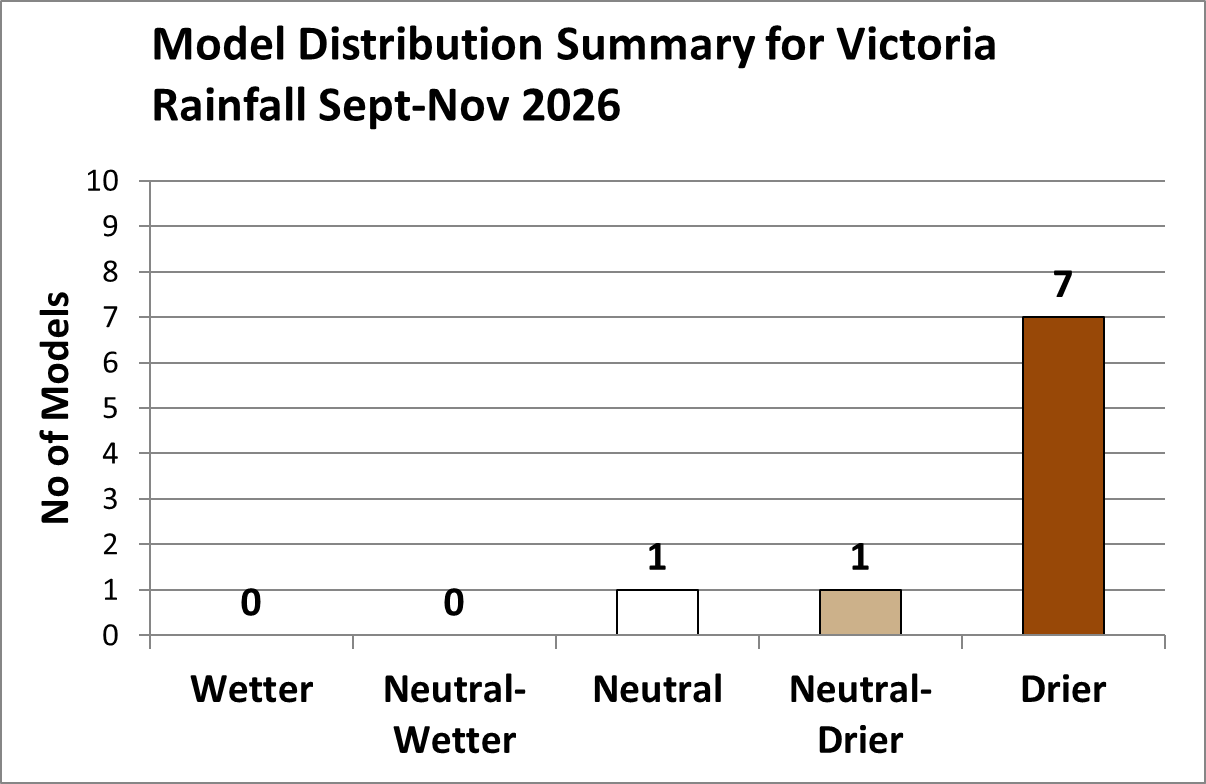
Model distribution summary for the next 4 to 6 months
Predictions for September to November 2026 Victorian rainfall – the outlook from 9 global model forecasts is for likely drier.
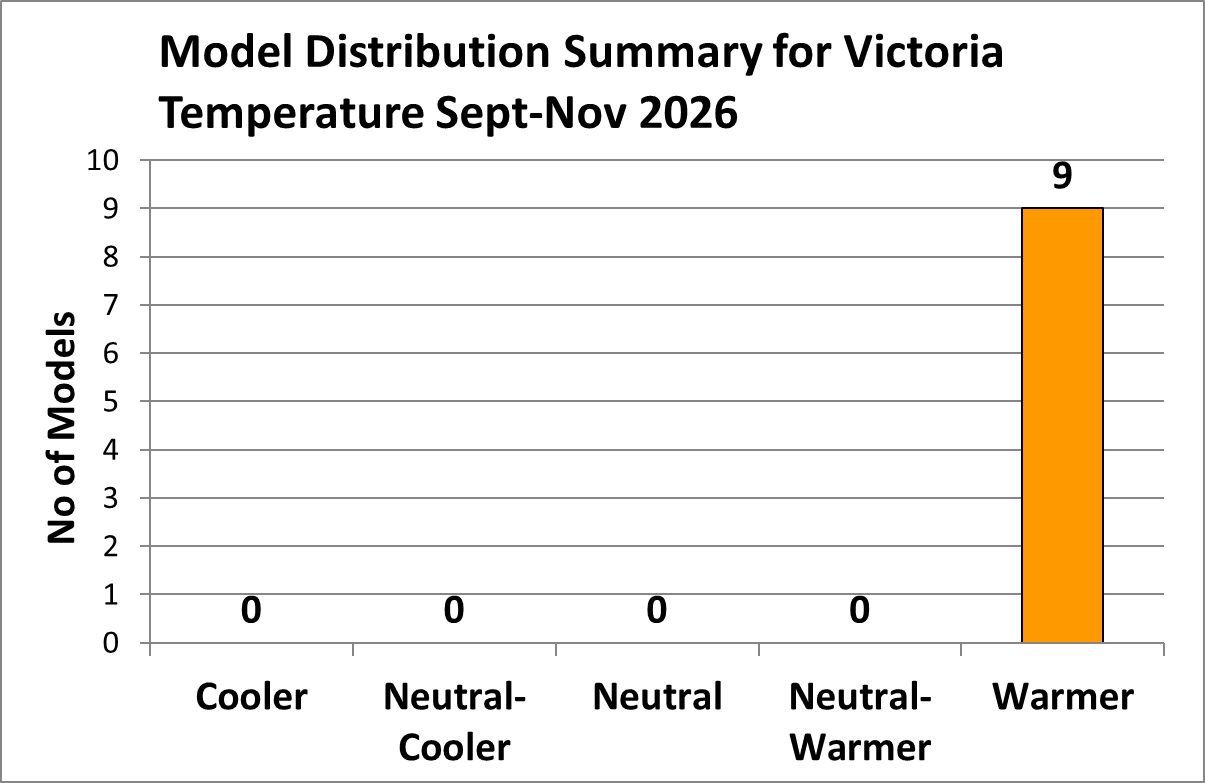
Predictions for September to November 2026 Victorian temperature – the outlook from 9 global model forecasts is for likely warmer.
Model consensus forecast for the next 6 months
Current outlook (27 May 2026)
| Phenomenon | June–August 2026 | September–November 2026 |
|---|---|---|
| Pacific Ocean | Warm (El Niño) | Warm (El Niño) |
| Indian Ocean | Mixed | Cooler (+IOD) |
| Rainfall | Drier | Drier |
| Temperature | Warmer | Warmer |
Previous outlook (27 April 2026)
| Phenomenon | May–July 2026 | August–October 2026 |
|---|---|---|
| Pacific Ocean | Warm (El Niño) | Warm (El Niño) |
| Indian Ocean | Cool/(+IOD) | Cool/(+IOD) |
| Rainfall | Drier | Drier |
| Temperature | Warmer | Warmer |
Sea surface temperature (SST) anomalies
During May the eastern equatorial Pacific Ocean surface has continued to slowly warm. The relative oceanic values for NINO3 and NINO3.4 were +1.08 °C and +0.67 °C respectively (24 May); the NINO3.4 region – which is the region that affects eastern Australia most – is getting close to the El Niño value of +0.8 °C.
Seas in Australia’s tropical north are average or warmer than average, indicating the moisture source regions are behaving normally or better.
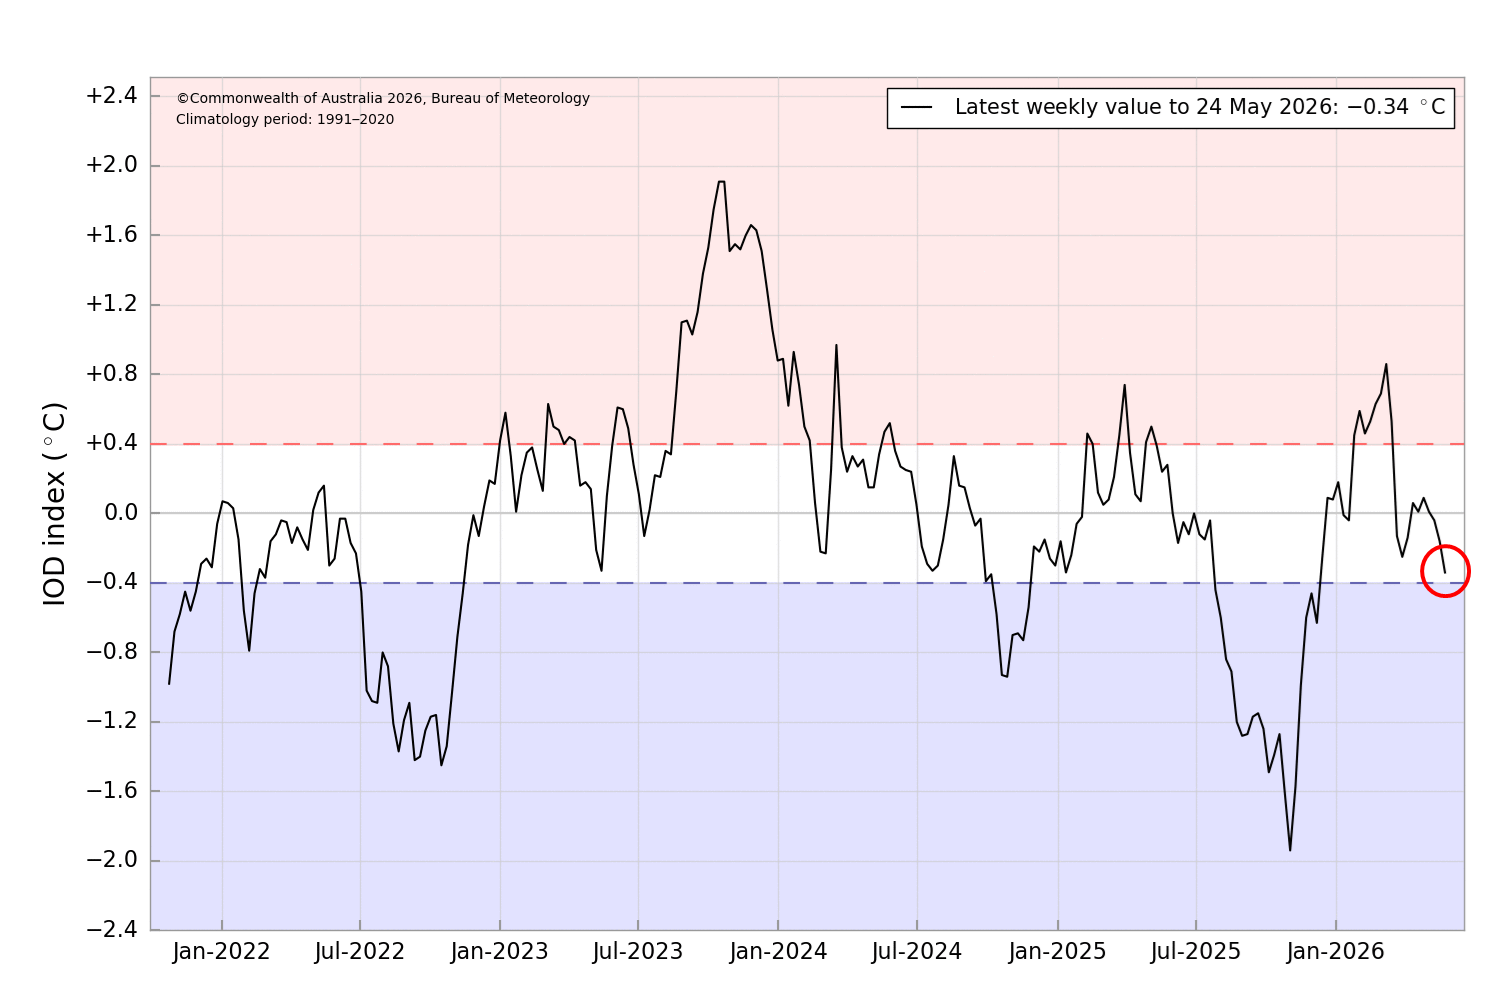
The Indian Ocean is generally warm across the basin and is neutral for IOD behaviour. The Dipole Mode Index value is currently at −0.34 °C (24 May). While this value is close to the −IOD value of −0.4 °C, it’s not exhibiting the classic shape of a warmer ‘eye’ off Sumatra and the negative value is reflecting the broad area of warmer water east of Indonesia.
Sea surface temperatures are the key to the world’s rainfall. For more information on how they are measured, maps created and how to read them, check out our eLearn.
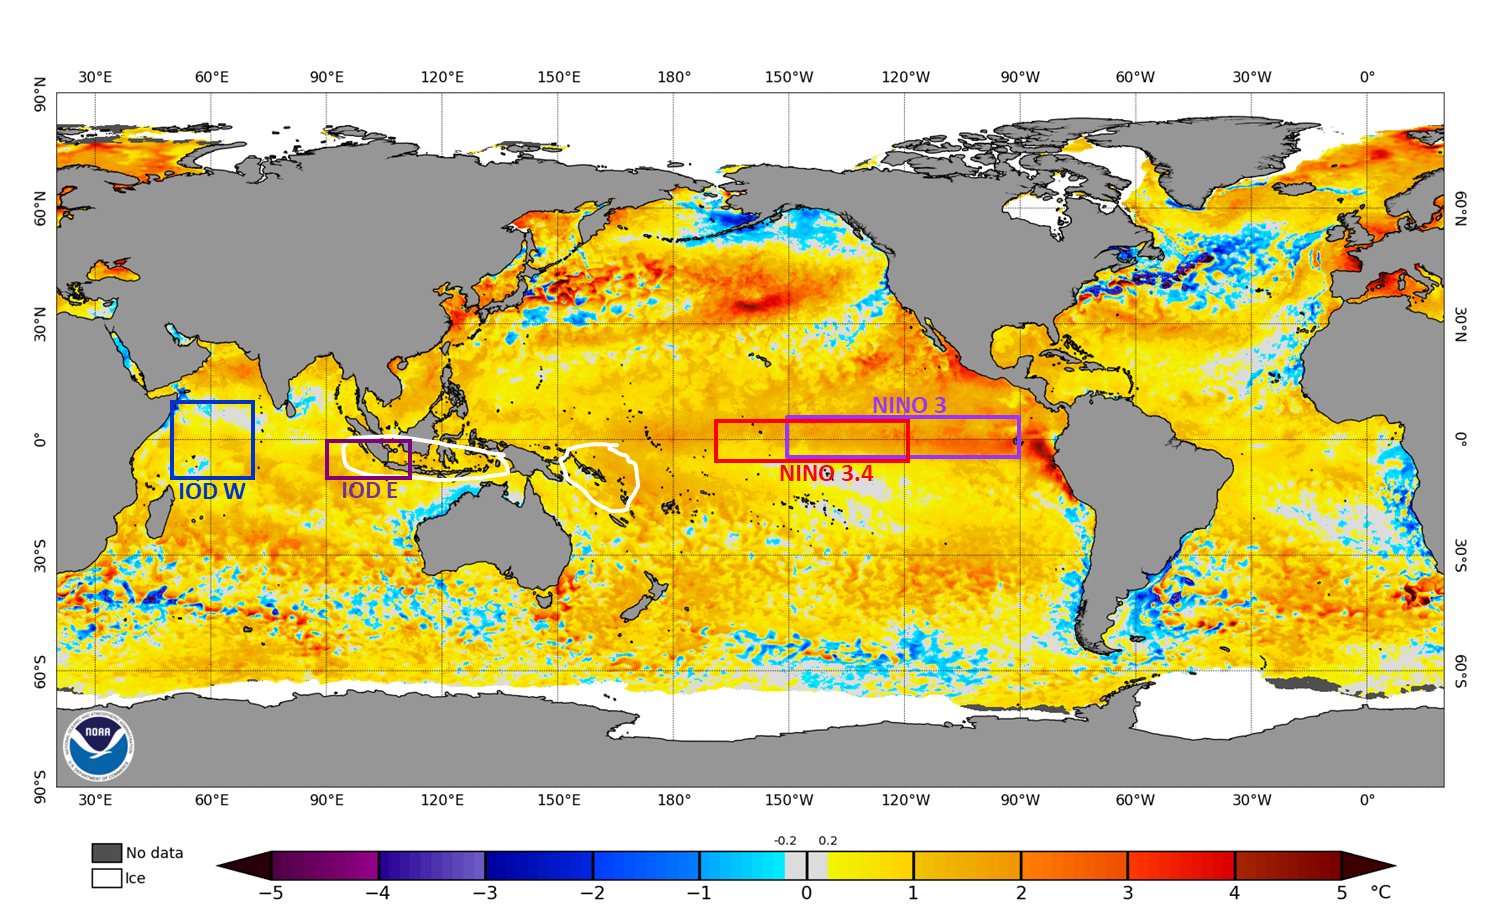
National Oceanic and Atmospheric Administration (NOAA) Coral Reef Watch Daily 5 km SST Anomalies (Version 3.1) 25 May 2026.
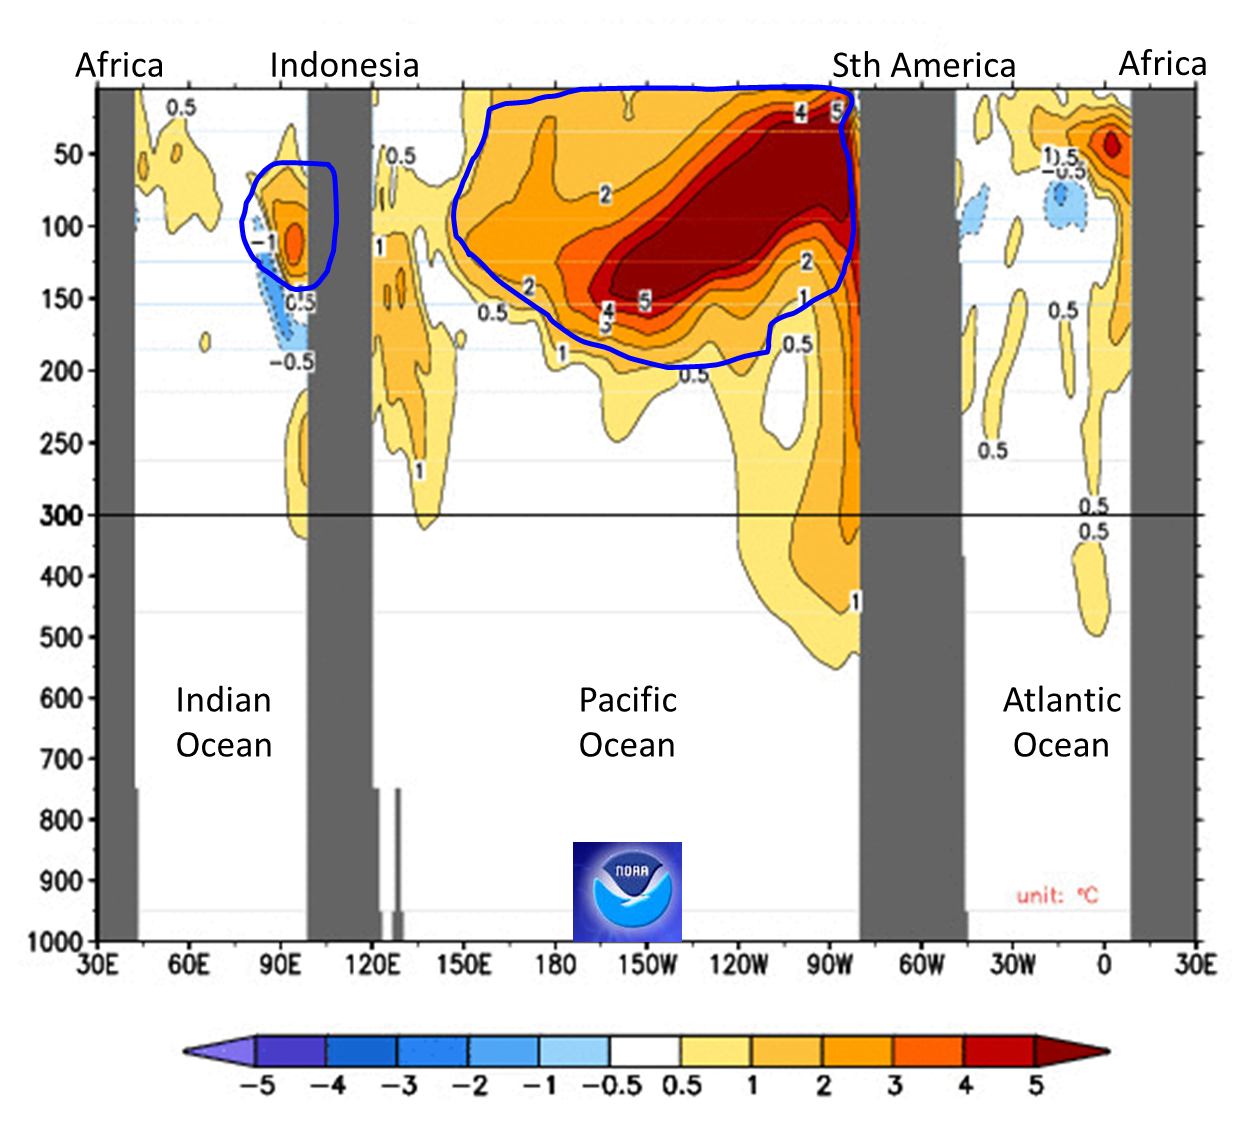
Equatorial last 30-day subsea temperature anomalies
Average of 23 April to 18 May 2026
The Pacific Ocean equatorial subsurface temperatures have progressed further eastwards and upwards, now upwelling warmer across the central two-thirds. This is a pre El Niño-like pattern.
The eastern Indian Ocean is slightly warmer to depth and provides little evidence of any pre-IOD states.
Southern Oscillation Index (SOI)
30-day moving SOI 25 May 2026
The SOI is the difference in air pressure between Tahiti and Darwin.
During May the SOI has stayed at or below the −7 value for El Niño; currently at −9.6 (as of 25 May). This has been due to much lower pressure at Tahiti and normal pressure at Darwin. Despite negative values, the pressure to our tropical north (as measured at Darwin) has not been behaving El Niño-like. Classically, pressure increases across our tropical north in response to cooler waters due to an easterly move in the Walker circulation.
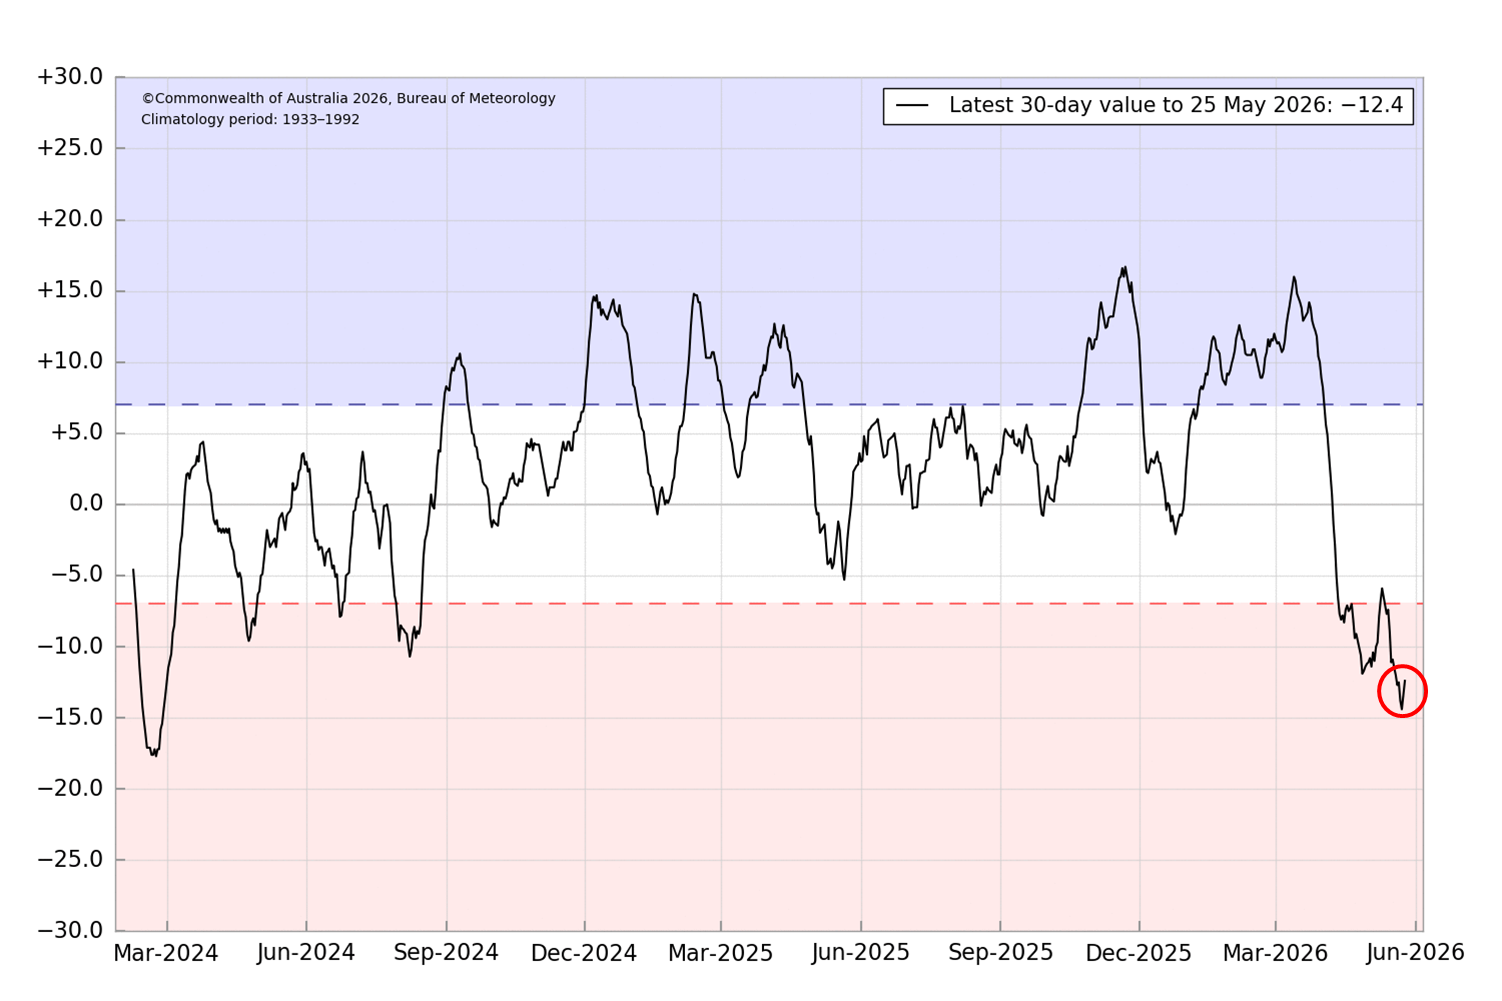
© Copyright Commonwealth of Australia 2026. Bureau of Meteorology. Climatology period 1933-1992.
Dipole Mode Index (DMI)
Latest weekly value to 24 May 2026
The DMI is the difference between the temperature of the west and east boxes of the Indian Ocean monitored for the IOD.
The DMI has fallen, currently sitting at −0.34 °C on 24 May and neutral, but close to the −IOD value of −0.4 °C. Stronger westerly winds in the eastern equatorial Indian Ocean have warmed the eastern Indian ocean over a large expanse. Despite a negative IOD value, the pattern of warming is not in keeping with a classic −IOD. Normally an ‘eye’ of warmer water would form off Sumatra, rather than a massive area of warm water.
© Copyright Commonwealth of Australia 2026. Bureau of Meteorology.
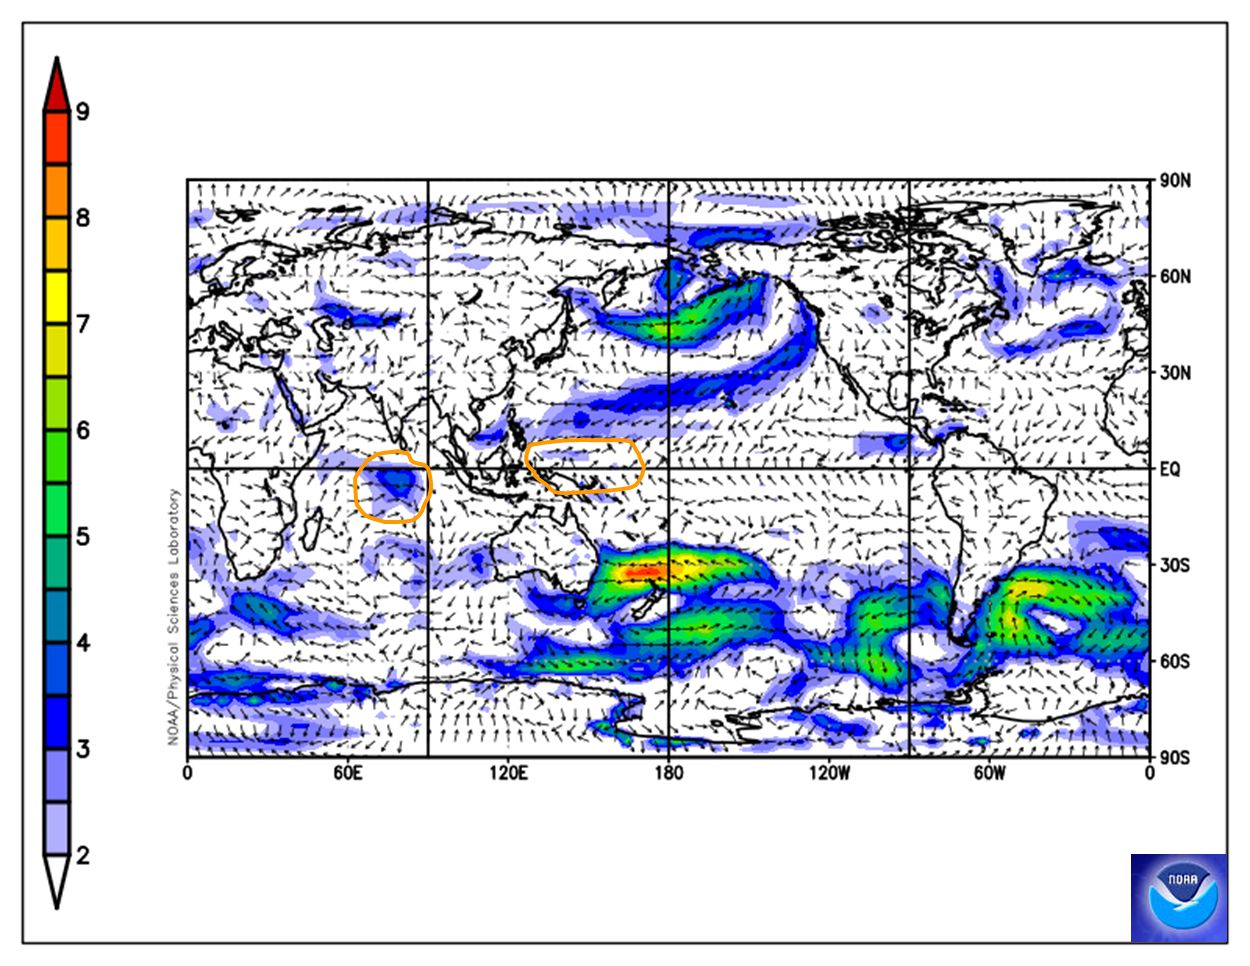
Pacific Ocean surface wind anomalies
Operational data surface winds 30-day anomaly for Monday 27 April to Tuesday 26 May 2026
Winds have been normal across the equatorial Pacific Ocean, where stronger westerly winds in the western Pacific would be a normal characteristic of an El Niño. Without more westerly wind support the atmosphere appears uninterested in El Niño at this stage.
In the Indian Ocean stronger westerly wind in the central Indian Ocean has now reached Indonesia in the last 7 days. This is the opposite of +IOD and more in keeping with −IOD, and why the eastern Indian ocean has warmed. The current burst would suggest further warming is possible.
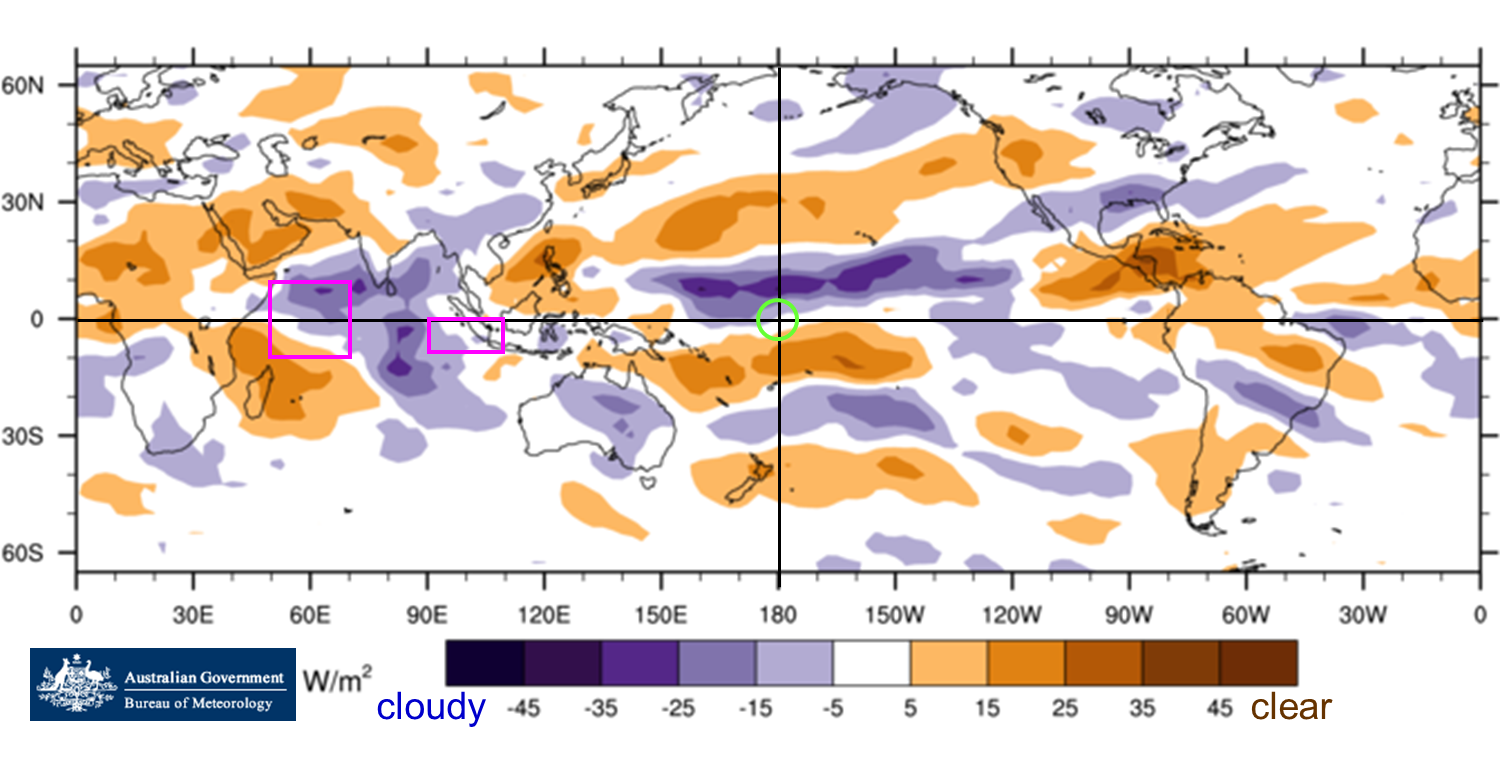
World cloudiness anomalies
OLR anomalies: Average of 25 April to 25 May 2026
Cloud at the junction of the Date Line and equator is normal. Classically, an El Niño would show a large region of less cloud at that location. The current pattern shows that the atmosphere is not interested in El Niño yet.
The Indian Ocean shows more cloud, it’s not apparent as to why.
Source: Bureau of Meteorology.
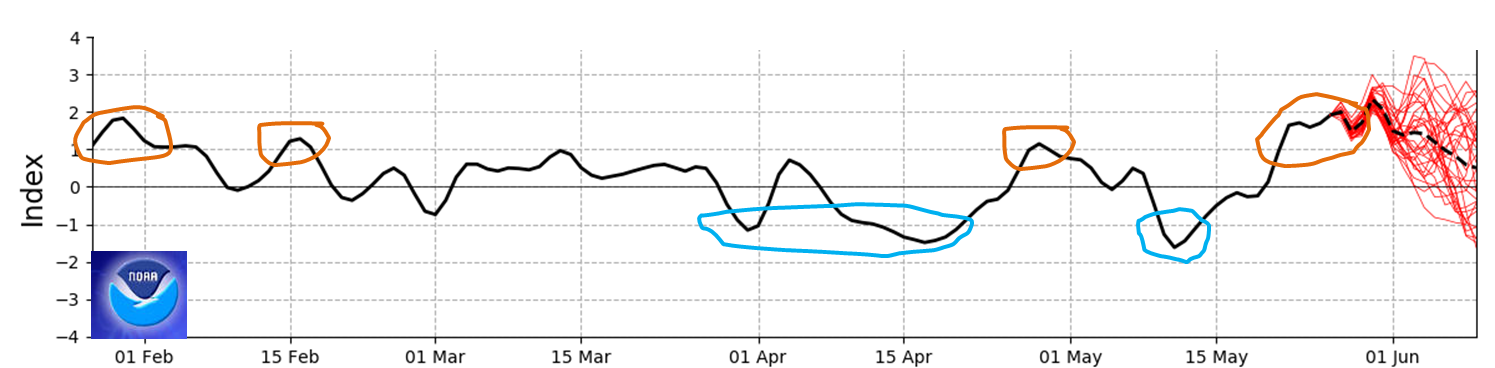
Southern Annular Mode (SAM)
AAO: observed and GFS forecasts. Observations 27 January to 26 May 2026
The Southern Annular Mode (SAM) or Antarctic Oscillation (AAO) spent a short burst in negativity then transitioned to a current moderately strong positive burst. The SAM has a varied effect historically on autumn climate. Winter behaviour in the SAM is more reliable where a +SAM would be expected to drag frontal systems south of Victoria. Both the NOAA and BoM ACCESS models predict a the SAM to slowly trend back to normal over the next 2 weeks.
Source: NOAA.
Madden–Julian Oscillation (MJO)
MJO phase diagram for 16 April to 25 May 2026
In the last month the MJO cloud band travelled across the Indian Ocean and northern Australia with no strength. It has recently popped up in the Coral Sea with moderate strength. This is probably providing some of the increased moisture feed to the eastern Australian coast at the moment.
Over the next 30 days the MJO is predicted to have a strong burst over the eastern Pacific Ocean (position 7), the Atlantic (position 8) and finishing across Africa (position 1). Historically these phases have had varied effects across Victoria.
The MJO is a cloud band travelling in an easterly direction just under the equator. It often takes around 40 days to complete a circumnavigation and can be a moisture source when its north of Australia at positions 5 and 6, particularly in winter and spring in Victoria.
Source: Bureau of Meteorology.
Air pressure
Operational data surface winds 30-day anomaly for Monday 27 April to Tuesday 26 May 2026
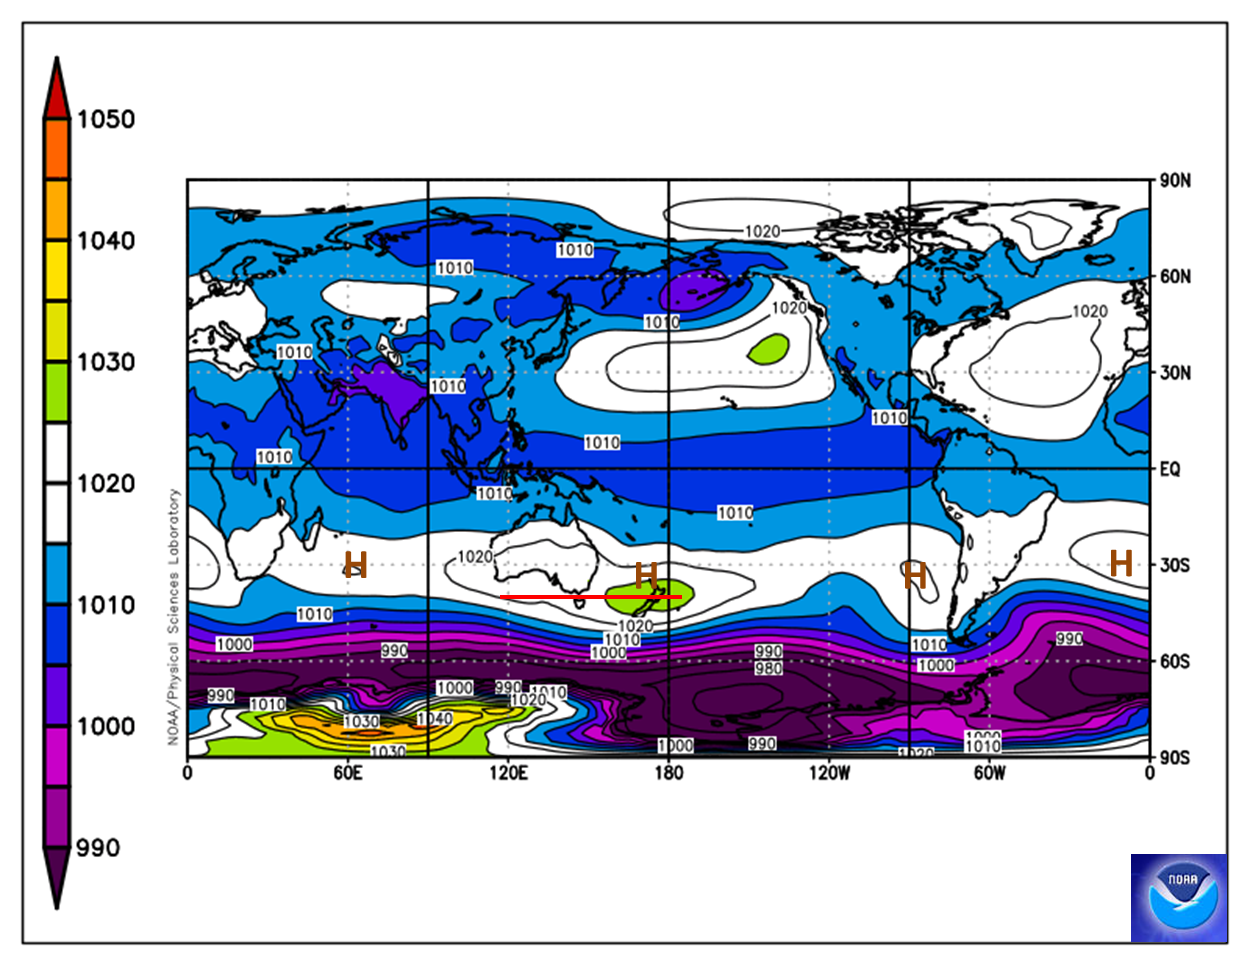
In the past 30 days the Sub Tropical Ridge of high pressure (STR) positioned a large high over southern Australia. The latitude was in a more southern position than normal, where an autumn position would be over Adelaide. This meant more downward pressure on rain-bearing systems and periods of stable weather. Despite this, gaps in pressure systems did deliver some rain.
Source: BoM.
Air pressure anomalies
Operational data surface winds 30-day anomaly for Monday 27 April to Tuesday 26 May 2026
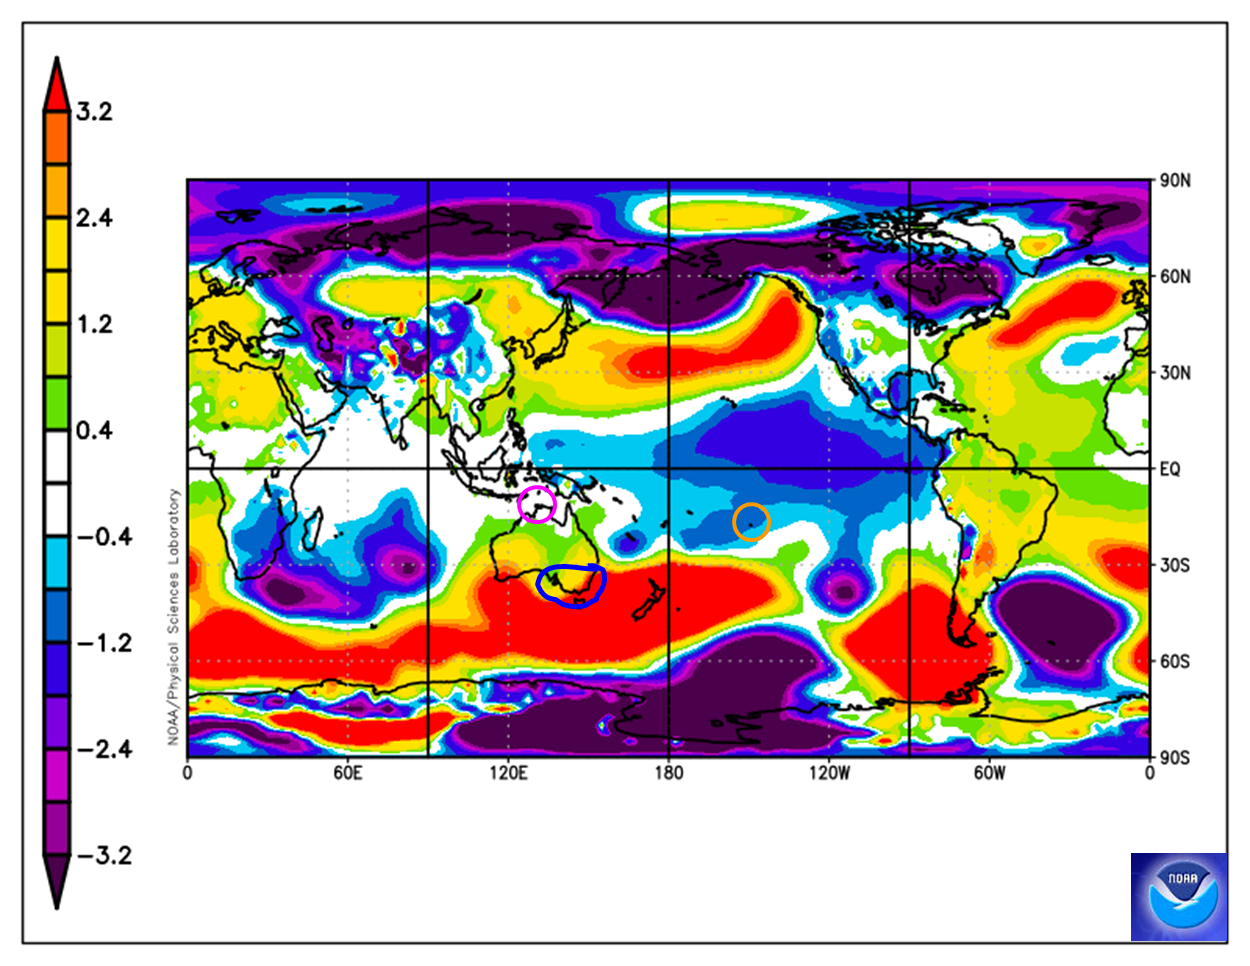
The Sub Tropical Ridge was higher in pressure over Victoria, indicating longer periods of stable weather and less frequent frontal activity. Much lower pressure at Tahiti and normal pressure at Darwin is why the SOI is negative. Pressure can exert its greatest influence over Victoria in winter.
Source: BoM.
Definitions
Read a list of climate acronyms and explanations.
Modelled climate and ocean predictions for Victoria from May 2026-run models
Twelve climate models show their predictions for the next 6 months for the Pacific Ocean, Indian Ocean, rainfall and temperature for Victoria.
View a colour-coded version of these tables ![]() [MS Word Document - 77.2 KB]
[MS Word Document - 77.2 KB]
Our e-learning module How to read the Fast Break table explains it.
Four coupled global circulation model forecasts
| Phenomenon | System 5 ECMWF Europe | ACCESS-S BoM Australia | SINTEX-F JAMSTEC Japan | CFSv2 NCEP USA |
|---|---|---|---|---|
| Month of run | May | May | May | May |
| Forecast months* | JJA | JJA | JJA | JJA |
| Rainfall skill JJA | Moderate | Moderate/low far E Gippsland | – | Low |
| Winter Pacific Ocean NINO3.4 | Warm (El Niño) | Warm (El Niño) | Warm (El Niño) | Warm (El Niño) |
| Winter eastern Indian Ocean | Normal | Slightly warm | Cool (+IOD) | Slightly warm |
| Winter rainfall | Slightly drier N, neutral S | Slightly drier | Slightly drier | Slightly drier/neutral E Gippsland |
| Winter temperature | Slightly warmer N, warmer S | Warmer | Slightly warmer | Slightly warmer |
| Forecast months* | SON | ASO | SON | SON |
| Spring Pacific Ocean NINO3.4 | Warm (El Niño) | Warm (El Niño) | Warm (El Niño) | Warm (El Niño) |
| Spring eastern Indian Ocean | Cool (+IOD) | Slightly warm | Cool (+IOD) | Slightly warm |
| Spring rainfall | Slightly drier N, drier S | – | Slightly drier | Slightly drier/neutral E Gippsland |
| Spring temperature | Slightly warmer W, warmer E | – | Warmer | Slightly warmer |
| Further info | Operational | Operational | Experimental | Operational |
Four coupled global circulation model forecasts
| Phenomenon | GEOS-S2S NASA USA | EPS JMA Japan | CSM1.1m BCC China | GloSea5 UKMO UK |
|---|---|---|---|---|
| Month of run | May | May | May | May |
| Forecast months* | JJA | JJA | JJA | JJA |
| Rainfall skill JJA | N/A | Moderate | Moderate E/low W | Moderate E/low W |
| Autumn Pacific Ocean NINO3.4 | Warm (El Niño) | Warm (El Niño) | Warm (El Niño) | Warm (El Niño) |
| Autumn eastern Indian Ocean | Cool (+IOD) | Normal | Slightly cool (weak +IOD) | Slightly warm |
| Autumn rainfall | Neutral | Slightly drier | Neutral, slightly drier SW, far E, slightly drier far NW | Neutral/slightly drier far E |
| Autumn temperature | Slightly warmer | Neutral | Warmer | Warmer |
| Forecast months* | SON | – | SON | ASO |
| Winter Pacific Ocean NINO3.4 | Warm (El Niño) | – | Warm (El Niño) | Warm (El Niño) |
| Winter eastern Indian Ocean | Slightly cool (+IOD) | – | Cool (+IOD) | Slightly warm |
| Winter rainfall | Neutral | – | Drier | Slightly drier S / neutral N |
| Winter temperature | Slightly warmer | – | Warmer | Warmer |
| Further info | Experimental | Experimental | Operational | Operational |
Three ensembles and a statistical model forecast
| Phenomenon | NMME USA | C3S Europe | MME APCC Korea | SOI phase USQ/Qld Australia |
|---|---|---|---|---|
| Month of run | May | May | May | May |
| Forecast months* | JJA | JJA | JJA | JJA |
| Rainfall skill JJA | Moderate N/low S | – | Moderate E/low W | – |
| Autumn Pacific Ocean NINO3.4 | Warm (El Niño) | Warm (El Niño) | Warm (El Niño) | SOI negative |
| Autumn eastern Indian Ocean | Slightly cool (weak +IOD) | Normal | Slightly warm | – |
| Autumn rainfall | Slightly drier | Slightly drier | Slightly drier | Neutral/slightly drier SW |
| Autumn temperature | Warmer | Warmer | Slightly warmer | – |
| Forecast months* | SON | ASO | ASO | – |
| Winter Pacific Ocean NINO3.4 | Warm (El Niño) | Warm (El Niño) | Warm (El Niño) | – |
| Winter eastern Indian Ocean | Slightly cool (+IOD) | Cool (+IOD) | Cool (+IOD) | – |
| Winter rainfall | Slightly drier | Drier, slightly drier E Gippsland | Slightly drier, drier SW | – |
| Winter temperature | Warmer | Warmer | Warmer | – |
| Further info | Experimental; Summary of 8 dynamic models | Experimental; Summary of 7 dynamic models | Experimental; Summary of 13 dynamic models | 5 phase system based on previous 2 months SOI |
* JJA = June, July, August; ASO = August, September, October; SON = September, October, November
Image references
Original images used in this document are sourced from the Bureau of Meteorology under a Creative Commons 3.0 licence and from the NOAA which has a public domain policy. Annotations highlighting areas of interest have been added by Dale Grey.